Regular readers of my blog will know that I enjoy analysing a good data set - and trying to turn them into simple charts that usually make everyone who seems them stop in their tracks and start to rethink what they thought they understood and knew.
Well, it's time for another 'pause and wonder' moment, as I turn my spreadsheets' gaze on charity mergers...
In the past I've looked at data on the 'churn rate' of charities (how many are being wound up each year, and also in comparison to the extent to which other legal forms are being wound up) - but recently, I came across the register of every charity merger since the end of 2007!
Now, despite my having been involved in 'refereeing' some mergers between charities in the past, it's always felt to me that there's something of a taboo about charities merging - Trustees don't usually seem that comfortable wanting to talk about it (unless their charity is in immediate threat of going bankrupt), by which point any other charities doesn't want to entertain taking it on as a liability which would drain and distract from their existing resources. Perhaps this is why about 3% of all charities are wound up each year in comparison to the 0.2% who merge. Does the variance in these figures suggest that charities are finding it easier to wind up, rather than be able to successfully merge with another charity?
This hypothesis, coupled with the time that a merger between charities can take (6-12 months if you want to do it properly?), seems to suggest that merging as a means for a charity to continue to see its purposes achieved beyond it's own existence is usually not taken up or enacted, even if it may transpire to be the best choice: Trustees are simply leaving things too late in the hope that something will magically resolve before feeling they can start talks with other charities about a merger option while there's still plenty of time (and reserves) to do things calming and in a less risky way.
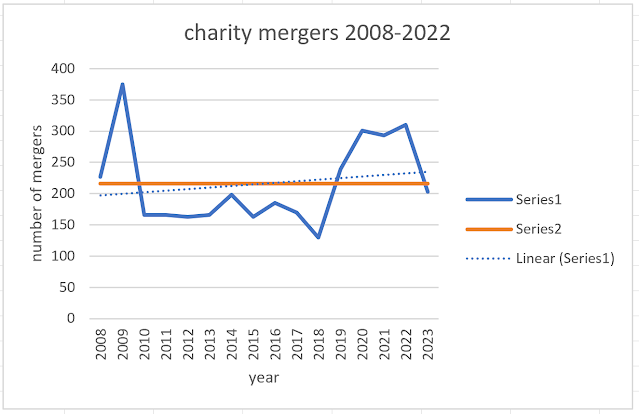
Well, here's the chart:
And to help you make sense of the squiggles in it
- the blue line shows the number of charity mergers happening each year. Interestingly, these started to significantly increase in the years BEFORE the Covid pandemic, and have now started to drop, even during the cost of living crisis. This suggests that massive financial shocks to the sector are not having any influence on charities exploring merging.
- the orange line shows the average number of mergers each year over the last 16 years.
- the dotted line is the next one of interest: it shows the linear trend of charity mergers over the last 16 years - admittedly, it's rising very slowly, but it's rising nonetheless, which suggests that ever so slowly, more charities are starting to pursue the merger option to best safeguard their purposes and support for their communities. For example - in the period 2016-2022, the likelihood a charity would merge increased by roughly 75%, in comparison with the likelihood a charity would be wound up increasing by approximately 10%.
But is it too little too late?
We're still seeing only 0.2% of all charities completing a merger each year in comparison to the far larger 3% who are wound up.
Perhaps this chart and the notes below it will help more Trustees start to explore the merger option sooner rather than later, and so better protect the people they were originally set up to support? And if they do, could this see a flipping of the current numbers, so that in the future, more charities merge than are wound up?

No comments:
Post a Comment